Key Metrics to Track for LLM Telemetry in Production
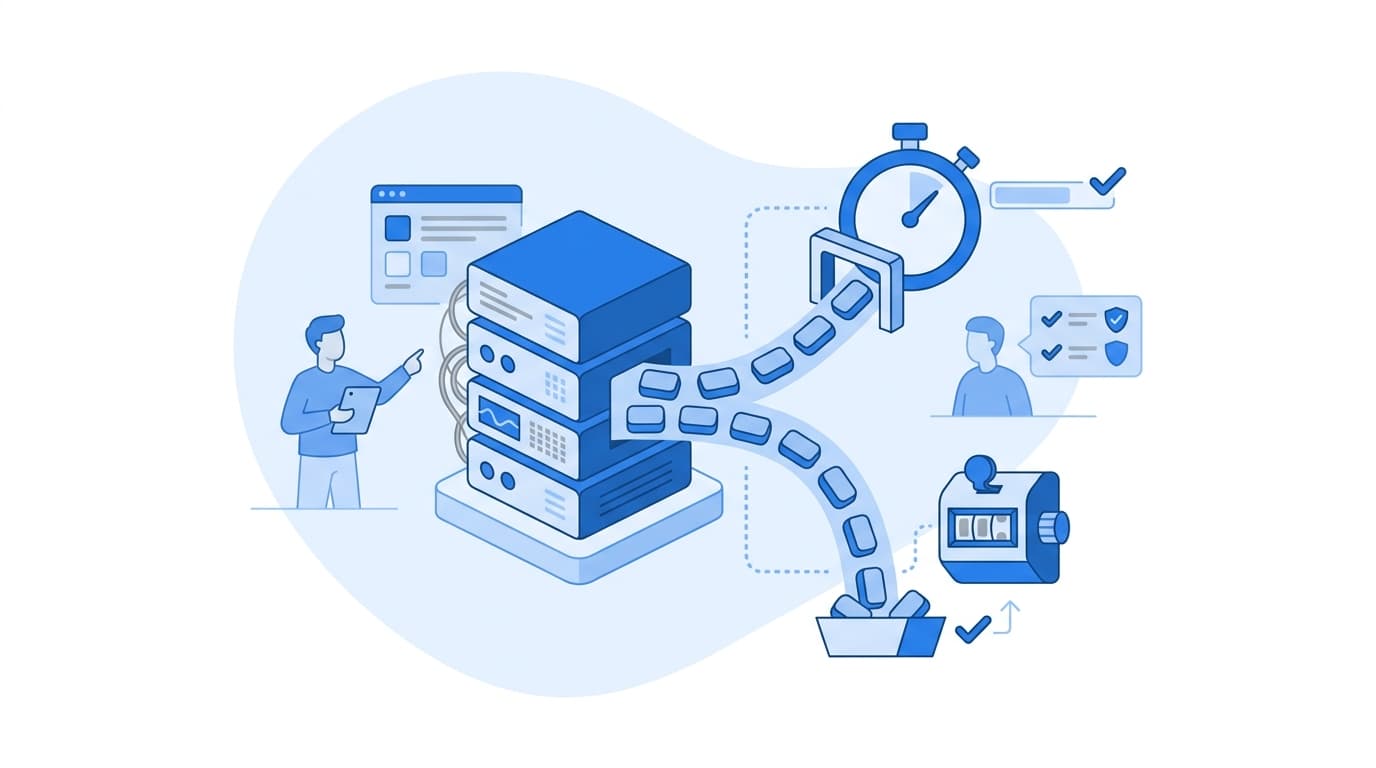
To run LLMs reliably in production, LLM telemetry should cover five groups of signals: latency (time to first token, time per output token, end-to-end duration), token usage and cost (input, output, and cached tokens attributed to features and tenants), errors and finish reasons (rate limits, timeouts, truncations, refusals, schema failures), output quality (evaluation scores, user feedback, groundedness), and saturation (queue depth, concurrency, and for self-hosted models, KV cache utilization). Every one of these signals needs consistent dimensions attached: model, model version, prompt template version, and the product feature that made the call. Without those dimensions, you can see that something changed but not why.
The rest of this post explains what each metric tells you, how to instrument it, and where teams commonly get it wrong.
Why LLM Telemetry Is Different From Ordinary API Monitoring
If you already monitor microservices, you have a head start. The four golden signals from Google's SRE book (latency, traffic, errors, saturation) still apply (Google SRE Book, "Monitoring Distributed Systems"). But LLM calls break a few assumptions:
- Latency depends on output length. A request that generates 2,000 tokens is not "slow" in the same way a 2-second database query is. You need to separate time to first token from generation speed.
- A 200 OK can still be a failure. The model can return valid HTTP and still produce truncated, refused, hallucinated, or unparseable output.
- Cost is per request and highly variable. Two calls to the same endpoint can differ in cost by orders of magnitude depending on prompt and response length.
- Behavior changes without a deploy. Provider model updates, prompt edits, or shifts in retrieved context can change outputs while your code stays identical.
So LLM telemetry has to measure the request, the tokens, and the content, not just the HTTP envelope.
Latency Tracking: Three Numbers, Not One
Time to First Token (TTFT)
TTFT measures how long the user waits before anything appears. For streaming chat interfaces, this is the latency users actually perceive. It is driven by queueing, prompt length (prefill cost), and network overhead. A rising TTFT with stable output lengths usually points to longer prompts (often from retrieval stuffing more context) or provider-side congestion.
Time Per Output Token (TPOT)
Also called inter-token latency, this is generation speed once streaming starts. It tells you whether the model is decoding at a normal rate. For self-hosted inference, degraded TPOT often indicates batching pressure or memory contention.
End-to-End Duration
Total request time matters for non-streaming workloads like batch summarization, agents, and tool-calling chains. For agentic flows, we recommend recording duration at both the individual LLM call and the overall workflow level, because a workflow with six sequential calls hides where the time went.
Always track percentiles, not averages. Report p50, p95, and p99. Averages smooth over the tail, and the tail is where users abandon sessions and where timeouts begin.
Here is a PromQL example for p95 TTFT by model, assuming you export a histogram:
histogram_quantile(
  0.95,
  sum by (le, model) (
    rate(llm_time_to_first_token_seconds_bucket[5m])
  )
)
Token Usage Monitoring and Cost Attribution
Token counts are the unit of both cost and capacity. Track them separately:
- Input (prompt) tokens: grows with system prompts, conversation history, and retrieved context.
- Output (completion) tokens: driven by task type and any max-token limits you set.
- Cached tokens: many providers report prompt-cache hits separately and price them differently. Your cache hit rate is a direct cost lever.
- Reasoning tokens: some models report internal reasoning tokens that are billed but not shown to the user. If your provider exposes them, record them.
The most useful practice is attribution. Tag every call with the feature, team, and (for multi-tenant products) the tenant. That lets you answer questions like "which feature doubled our spend last week?" rather than staring at a single invoice line.
Watch for these patterns:
- Input token creep: conversation history that is never truncated or summarized grows linearly with session length.
- Output length drift: a prompt change that makes responses more verbose raises both cost and latency.
- Retry amplification: automatic retries on rate limits can quietly multiply token spend.
Compute cost at query time from token counts and a versioned price table rather than hardcoding prices into application code. Provider pricing changes, and you want historical costs to remain accurate.
Errors, Finish Reasons, and Silent Failures
Transport and Provider Errors
Track these as separate error classes, not a single error rate:
- Rate limits (HTTP 429): signal you need quota increases, backoff tuning, or load shedding.
- Timeouts: often correlated with long outputs; compare against output token distributions.
- Server errors (5xx): provider or inference-server instability.
- Context length exceeded: a deterministic bug in your prompt assembly, not a transient fault.
Finish Reasons
Most APIs return a finish or stop reason with each response. Record it on every call. A rising share of length-truncated responses means your max-token limit is too low or outputs are getting longer. Content-filter finish reasons indicate safety systems are triggering, which may be correct behavior or may indicate a prompt that unintentionally invites refusals.
Application-Level Failures
These are the failures your provider can't see:
- Schema validation failures: the model was asked for JSON and returned something unparseable.
- Tool-call errors: the model called a tool with invalid arguments.
- Guardrail interventions: your own input or output filters blocked a response.
Count each one as a metric. In our experience, schema failure rate is one of the earliest warning signs after a model version change.
Measuring Output Quality in LLMOps
Quality is the hardest category to instrument, and no single metric captures it. A practical approach combines several signals:
- Explicit user feedback: thumbs up/down, edits, or regenerations. Regeneration rate is a useful implicit signal of dissatisfaction.
- Automated evaluations on sampled traffic: run a subset of production requests through evaluators (rule-based checks, reference comparisons, or model-graded rubrics) and track scores over time.
- Groundedness for RAG systems: measure whether answers are supported by retrieved documents, and track retrieval-side metrics such as the number of chunks returned and the relevance score distribution.
- Task completion: for agents, did the workflow reach its goal state?
Treat model-graded evaluations as a trend signal, not ground truth. They have their own biases, so calibrate them periodically against human review.
The critical step is versioning. Attach the prompt template version and model identifier to every quality score. When scores drop, you need to know whether it coincides with a prompt deploy, a model change, or a shift in input data.
Saturation and Capacity
For hosted APIs, saturation shows up as rate-limit errors and rising TTFT. Track your usage against provider quotas (requests and tokens per minute) so you see the ceiling before you hit it.
For self-hosted inference, you have more visibility. Inference servers such as vLLM expose Prometheus metrics including running and waiting request counts, TTFT and per-token latency histograms, and KV cache utilization (vLLM metrics documentation). Metric names vary between versions, so pin your dashboards to the version you run. Queue depth (waiting requests) is typically the clearest leading indicator that you need more capacity.
Instrumenting LLM Telemetry With OpenTelemetry
Rather than inventing your own attribute names, we suggest adopting the OpenTelemetry semantic conventions for generative AI (OpenTelemetry GenAI semantic conventions). They define standard span attributes such as gen_ai.request.model, gen_ai.usage.input_tokens, gen_ai.usage.output_tokens, and gen_ai.response.finish_reasons, plus metrics like gen_ai.client.token.usage and gen_ai.client.operation.duration. The conventions are still marked as in development, so expect some churn, but standard names make it far easier to switch backends or providers later.
A minimal Python example wrapping a chat call:
from opentelemetry import trace, metrics
import time

tracer = trace.get_tracer("llm.client")
meter = metrics.get_meter("llm.client")

token_usage = meter.create_histogram(
    "gen_ai.client.token.usage", unit="{token}"
)
duration = meter.create_histogram(
    "gen_ai.client.operation.duration", unit="s"
)

def call_llm(client, model, messages, feature, prompt_version):
    attrs = {
        "gen_ai.operation.name": "chat",
        "gen_ai.request.model": model,
        "app.feature": feature,
        "app.prompt_version": prompt_version,
    }
    with tracer.start_as_current_span(f"chat {model}", attributes=attrs) as span:
        start = time.monotonic()
        resp = client.chat.completions.create(model=model, messages=messages)
        elapsed = time.monotonic() - start

        usage = resp.usage
        span.set_attribute("gen_ai.usage.input_tokens", usage.prompt_tokens)
        span.set_attribute("gen_ai.usage.output_tokens", usage.completion_tokens)
        span.set_attribute(
            "gen_ai.response.finish_reasons",
            [c.finish_reason for c in resp.choices],
        )

        duration.record(elapsed, attrs)
        token_usage.record(usage.prompt_tokens, {**attrs, "gen_ai.token.type": "input"})
        token_usage.record(usage.completion_tokens, {**attrs, "gen_ai.token.type": "output"})
        return resp
For streaming calls, record a timestamp when the first chunk arrives to capture TTFT, and divide remaining generation time by output tokens for TPOT.
A Note on Prompt and Response Content
Capturing full prompts and completions is extremely useful for debugging, but it often contains personal or sensitive data. Make content capture opt-in and separately controlled from metrics, apply redaction before storage, set short retention, and restrict access. The OpenTelemetry conventions themselves treat content capture as opt-in for this reason. If you operate in regulated sectors, align this with your data handling obligations; our page on industries we work with covers how these constraints differ by domain.
Putting It Together: A Starter Dashboard
If you're starting from scratch, build one dashboard with these panels, each filterable by model, feature, and prompt version:
- Request rate and error rate by error class
- p50/p95/p99 TTFT and end-to-end duration
- Input, output, and cached tokens per minute
- Estimated cost per feature per day
- Finish reason distribution
- Schema and guardrail failure rates
- Sampled evaluation scores and user feedback trend
- Quota utilization or inference queue depth
Alert on symptoms users feel (tail latency, error rate, schema failures) and review cost and quality trends on a regular cadence rather than paging on them. If you want help designing an observability stack for AI workloads, see our data, AI, and MLOps capabilities.
FAQ
What is LLM telemetry?
LLM telemetry is the collection of metrics, traces, and logs that describe how large language model calls behave in production. It covers latency, token usage, cost, errors, output quality, and capacity, tagged with model and prompt version so changes can be traced to causes.
Which latency metric matters most for LLM applications?
For streaming, user-facing applications, time to first token usually matters most because it determines perceived responsiveness. For batch or agentic workloads, end-to-end duration is more relevant. Track both, and always use percentiles rather than averages.
How do I monitor token usage without overspending on observability?
Record token counts as metrics on every call, since they are cheap numeric values. Reserve full prompt and response logging for sampled traffic or debugging sessions, with redaction and short retention, because content storage is where observability costs and privacy risks grow.
Should I use OpenTelemetry for LLM metrics?
It is a sensible default. The OpenTelemetry generative AI semantic conventions provide standard attribute and metric names, which keeps your telemetry portable across providers and observability backends. The conventions are still evolving, so pin versions and review changes when upgrading.
How do I detect quality regressions in production?
Combine user feedback signals like regeneration rate with automated evaluations on sampled traffic, and tag every score with the model and prompt version. A drop in scores that lines up with a version change is your clearest regression signal.