What Is Data Observability and Why Is It Critical for AI/ML SaaS?

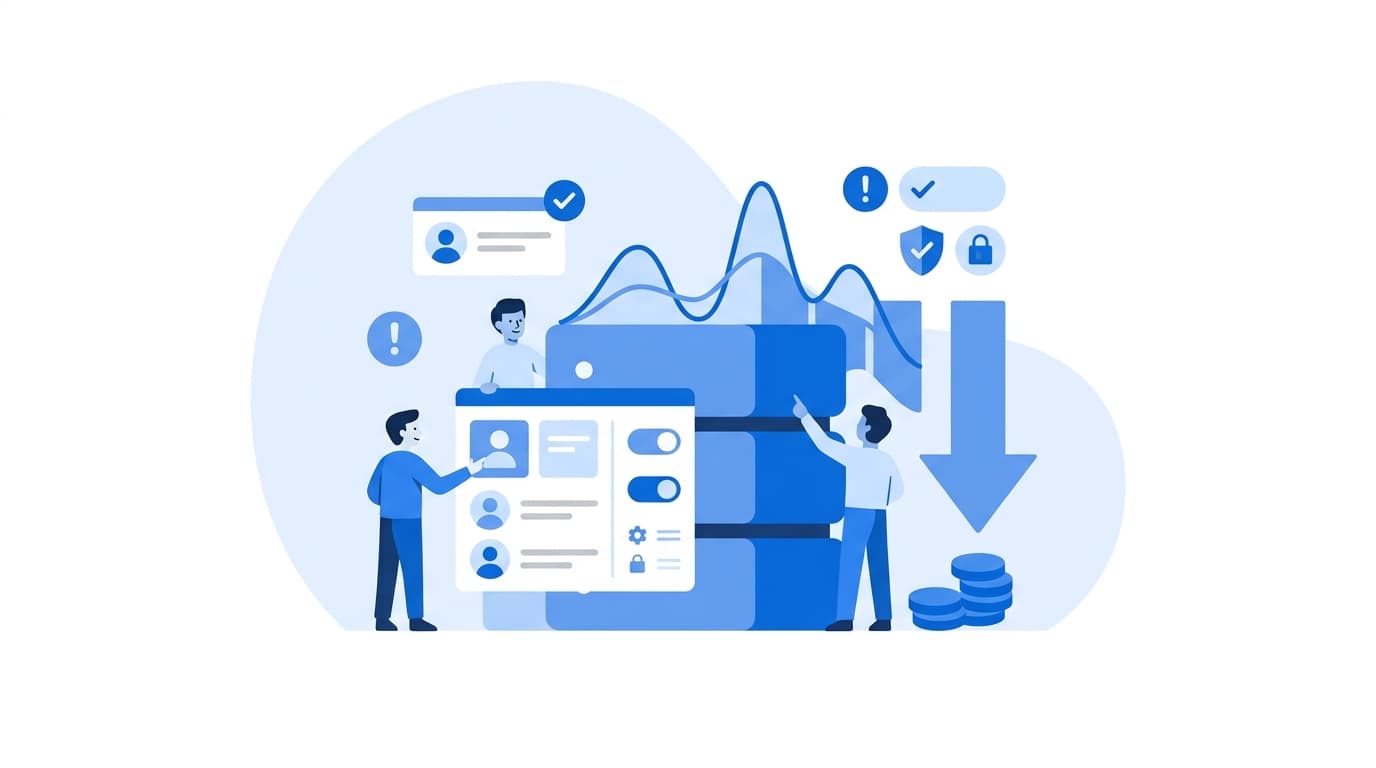
What is data observability? It is the practice of continuously monitoring the health of your data as it moves through pipelines, so you can detect, diagnose, and resolve problems before they reach dashboards, customers, or models. For AI/ML SaaS products this matters more than almost anywhere else. A machine learning model does not crash when its input data goes bad. It keeps returning predictions that are confidently wrong, and nothing in your application logs will flag it.
If you run a product where models drive recommendations, scoring, forecasts, or automated decisions, the quality of your data in production is the quality of your product. This post explains what data observability covers, how it differs from traditional monitoring, and how we approach building it into production ML systems.
What Is Data Observability? A Working Definition
The term borrows from software observability, where metrics, logs, and traces let engineers ask new questions about a running system without shipping new code. Data observability applies the same idea to datasets and pipelines. Instead of asking "is the service up?", you ask:
- Did the data arrive when it was supposed to?
- Is there the expected amount of it?
- Does it have the shape we expect?
- Do the values look like they usually do?
- If something broke, what upstream source caused it and what downstream assets are affected?
Observability vs. monitoring vs. data quality testing
These terms overlap, and the distinctions are worth being precise about:
- Data quality testing is assertion-based. You write rules ("
order_totalis never negative") and run them, often in CI or as pipeline steps. Tools like Great Expectations and dbt tests live here. - Data pipeline monitoring tracks whether jobs ran, how long they took, and whether they failed. It tells you the pipeline executed, not that the output is correct.
- Data observability combines both and adds statistical baselining, anomaly detection, and lineage. It is designed to catch problems you did not think to write a test for.
A useful mental model: tests catch known unknowns, observability helps with unknown unknowns. You need both.
The Core Signals of Data Observability
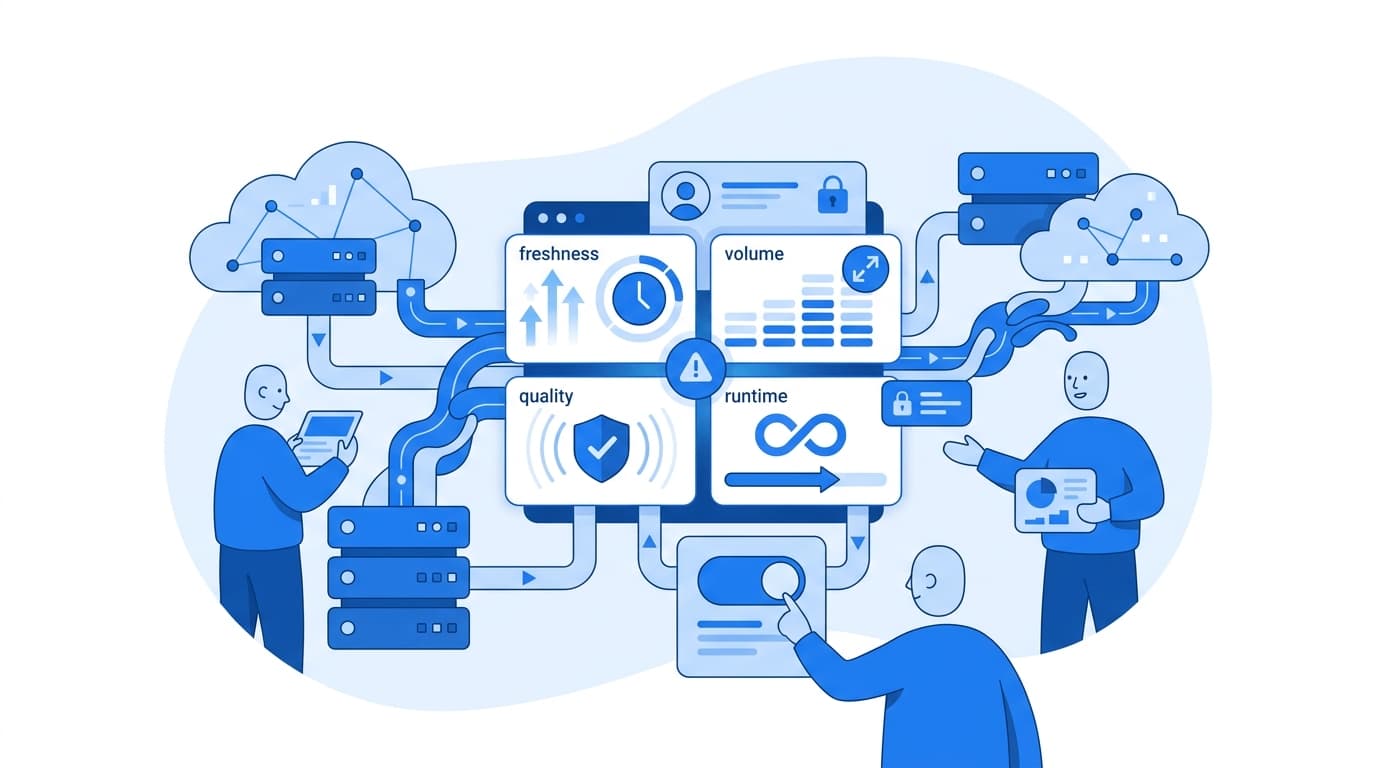
Most practitioners organize data observability around five signal categories. None of them is exotic. The value comes from measuring them consistently across every critical table and feature.
- Freshness: when was this data last updated, and is that within the expected window?
- Volume: are row counts or event counts within a normal range?
- Schema: have columns been added, removed, renamed, or retyped?
- Distribution: have null rates, cardinality, ranges, or value distributions shifted?
- Lineage: which upstream sources feed this asset, and which downstream consumers depend on it?
A freshness check can be as simple as a scheduled query:
-- Alert if user_events has not received data in the last 2 hours
SELECT
  MAX(event_ts)                      AS latest_event,
  CURRENT_TIMESTAMP - MAX(event_ts)  AS lag
FROM analytics.user_events
HAVING CURRENT_TIMESTAMP - MAX(event_ts) > INTERVAL '2 hours';
Any row returned is an alert. The hard part is not writing this query. It is deciding the right threshold for hundreds of tables, maintaining those thresholds as the business changes, and routing alerts to someone who can act on them. That is where baselining and ownership come in.
Why Data Observability Is Critical for AI/ML SaaS
Analytics teams care about data quality because bad data produces bad reports. ML teams have a harder version of the same problem, for several structural reasons.
Models fail silently
A broken dashboard usually gets noticed by a human. A model fed a feature that has quietly become 40% null (or zero, or a default value) will still produce output. Sculley et al., in Hidden Technical Debt in Machine Learning Systems (NeurIPS 2015), described how ML systems accumulate dependencies on data that are harder to detect than code dependencies. Data observability is how you make those dependencies visible.
Training-serving skew
Features computed one way in a batch training pipeline and another way in a real-time serving path will drift apart. Google's work on data validation for ML (Breck et al., Data Validation for Machine Learning, MLSys 2019) treats skew detection as a first-class concern. Comparing the distribution of features at serving time against the training distribution is one of the highest-value checks you can run.
Multi-tenant data multiplies the surface area
In SaaS, each customer's data arrives through different integrations, configurations, and usage patterns. A schema change in one tenant's CRM connector can degrade predictions for that tenant alone, while aggregate metrics look fine. Segmenting observability by tenant (or by integration source) is often the difference between catching an issue in hours versus hearing about it from a customer.
Labels arrive late, or never
In many production ML systems, ground truth arrives days or weeks after a prediction, if at all. You cannot rely on accuracy metrics to tell you something is wrong today. Input data and prediction distributions are your leading indicators. Ground-truth performance is the lagging one.
The data work is undervalued
Sambasivan et al.'s CHI 2021 paper, "Everyone wants to do the model work, not the data work", documented how data issues compound downstream in high-stakes ML projects. In our experience the same dynamic shows up in commercial SaaS: teams invest heavily in model architecture and comparatively little in the pipelines that feed it.
What Good Data Observability Looks Like in Production ML
We find it helpful to think in layers, each catching a different class of failure.
Layer 1: Contracts at ingestion
Define what producers promise to deliver. A lightweight data contract makes expectations explicit and reviewable:
# contracts/user_events.yaml
dataset: analytics.user_events
owner: platform-data@yourcompany.example
freshness:
  max_lag: 2h
schema:
  - name: user_id
    type: string
    nullable: false
  - name: event_type
    type: string
    allowed_values: [view, click, purchase, refund]
  - name: event_ts
    type: timestamp
    nullable: false
volume:
  min_rows_per_hour: baseline_p05
Contracts shift detection left: schema breaks get caught at the boundary instead of inside a feature pipeline three hops later.
Layer 2: Pipeline and warehouse checks
Run freshness, volume, and schema checks on every table that feeds a model. Add statistical baselines for volume and null rates rather than hard-coded thresholds where seasonality matters.
Layer 3: Feature and prediction monitoring
This is where ML-specific observability lives. Compare current feature distributions against a reference window (often the training set). The Population Stability Index (PSI) is a simple, widely used drift measure:
import numpy as np

def psi(reference, current, bins=10, eps=1e-6):
    """Population Stability Index between two numeric samples."""
    edges = np.unique(np.quantile(reference, np.linspace(0, 1, bins + 1)))
    edges[0], edges[-1] = -np.inf, np.inf
    ref_pct = np.histogram(reference, edges)[0] / len(reference)
    cur_pct = np.histogram(current, edges)[0] / len(current)
    ref_pct = np.clip(ref_pct, eps, None)
    cur_pct = np.clip(cur_pct, eps, None)
    return float(np.sum((cur_pct - ref_pct) * np.log(cur_pct / ref_pct)))
Common heuristics treat PSI below 0.1 as stable and above 0.25 as significant drift, but treat those as starting points. Tune thresholds per feature based on how much drift actually affects model behavior. Monitor the prediction distribution too. A sudden shift in the share of "high-risk" scores is often the first visible symptom of an upstream data problem.
Lineage ties the layers together
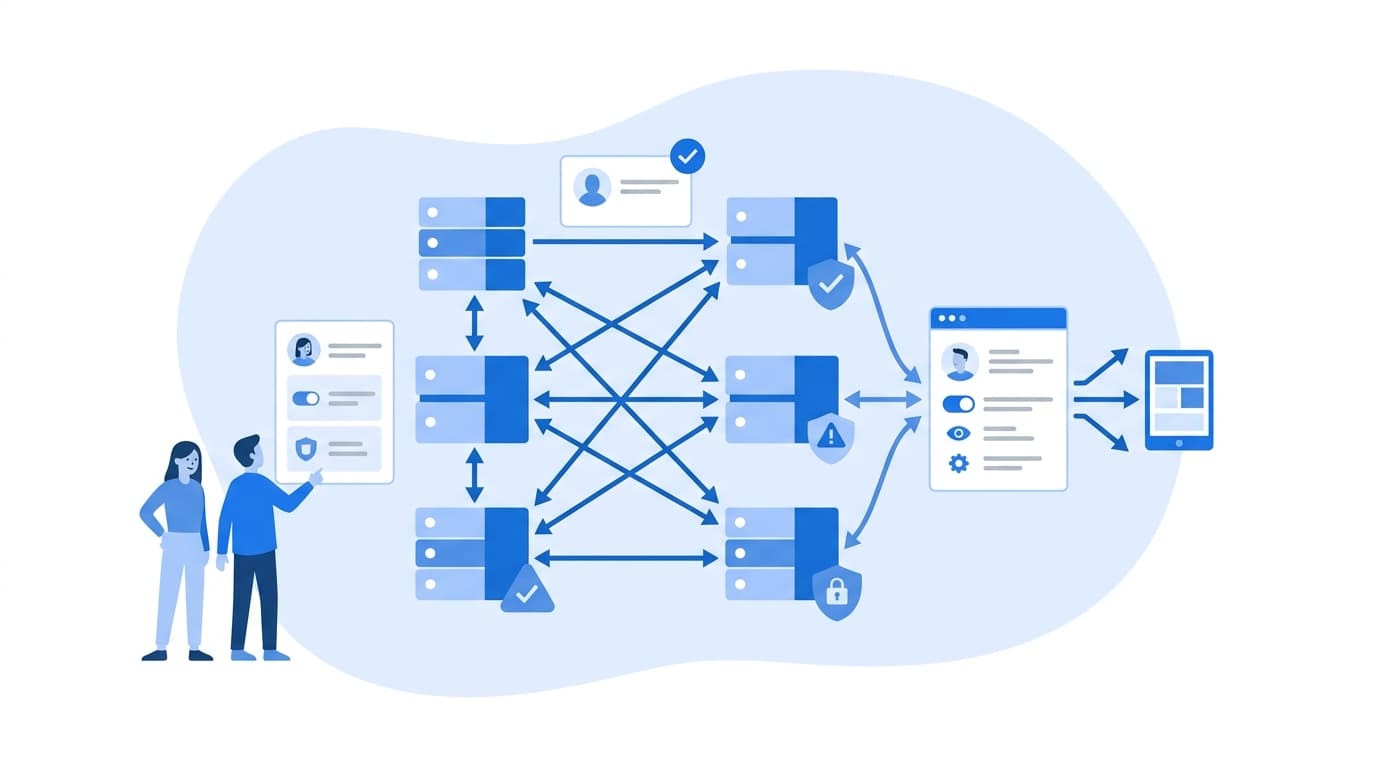
When a drift alert fires on a feature, you need to know which source tables feed it, which jobs transform it, and which models and customers consume it. Open standards such as OpenLineage let orchestrators and warehouses emit lineage events in a common format, so root-cause analysis does not depend on tribal knowledge.
Common Mistakes to Avoid
- Alerting on everything. Hundreds of low-signal alerts train people to ignore all of them. Start with assets that directly feed production models.
- No ownership. Every monitored asset needs a named owner and an escalation path. An alert without an owner is just a log line.
- Monitoring only aggregates. Global metrics hide tenant-level or segment-level breakage.
- Treating it as a tool purchase. Tooling helps, but observability is an operating practice: contracts, runbooks, incident reviews, and feedback into pipeline design.
- Ignoring the serving path. Validating training data while leaving online features unmonitored misses the skew problem entirely.
Where to Start
If you are building data observability for an ML product from scratch, a practical sequence is:
- Inventory the critical path. List every table and feature that feeds a production model.
- Add freshness, volume, and schema checks to those assets. These are cheap and catch a large class of incidents.
- Assign owners and route alerts to the right on-call channel.
- Add distribution and drift monitoring on model inputs and outputs, segmented by tenant where relevant.
- Capture lineage so alerts come with context about upstream causes and downstream impact.
- Review incidents and convert recurring failure modes into contracts or tests.
Teams working through this often find the gaps are less about tooling and more about pipeline design and operational discipline. If you want to see how we approach production data and MLOps engineering, our data, AI, and engineering capabilities page outlines the work, and our industries overview covers how these patterns apply across different regulated and high-scale environments.
References
- Sculley, D. et al. Hidden Technical Debt in Machine Learning Systems. NeurIPS 2015.
- Breck, E. et al. Data Validation for Machine Learning. MLSys 2019.
- Sambasivan, N. et al. "Everyone wants to do the model work, not the data work": Data Cascades in High-Stakes AI. CHI 2021.
- OpenLineage project: openlineage.io
- TensorFlow Data Validation: tensorflow.org/tfx/data_validation
- Great Expectations: greatexpectations.io
FAQ
What is data observability in simple terms?
Data observability is the ability to understand the health of your data at any point in your pipelines. It tracks freshness, volume, schema, distributions, and lineage so teams can detect and fix data problems before they affect reports, products, or ML models.
How is data observability different from data quality?
Data quality describes whether data is fit for use. Data observability is the practice and tooling that continuously measures it. Quality tests check rules you already know about. Observability adds anomaly detection and lineage to catch issues you did not anticipate and trace them to a root cause.
Is data observability the same as ML model monitoring?
They overlap but are not the same. Model monitoring focuses on model outputs and performance. Data observability covers the upstream pipelines and features that feed the model. In production ML you need both, because many model degradations originate as data problems.
Which metrics should we monitor first for an ML product?
Start with freshness, row volume, and schema checks on every table feeding a production model. Then add null-rate and distribution monitoring on model features, plus a drift metric such as PSI comparing serving data to training data. Segment by tenant if you run a multi-tenant SaaS.
Do we need a dedicated data observability platform?
Not necessarily to start. SQL checks, open-source validation libraries, and your existing orchestrator can cover the basics. Dedicated platforms become more valuable as the number of assets, teams, and models grows and manual threshold management stops scaling.