How to Track LLM Telemetry: Latency, Cost, and Quality Metrics That Matter
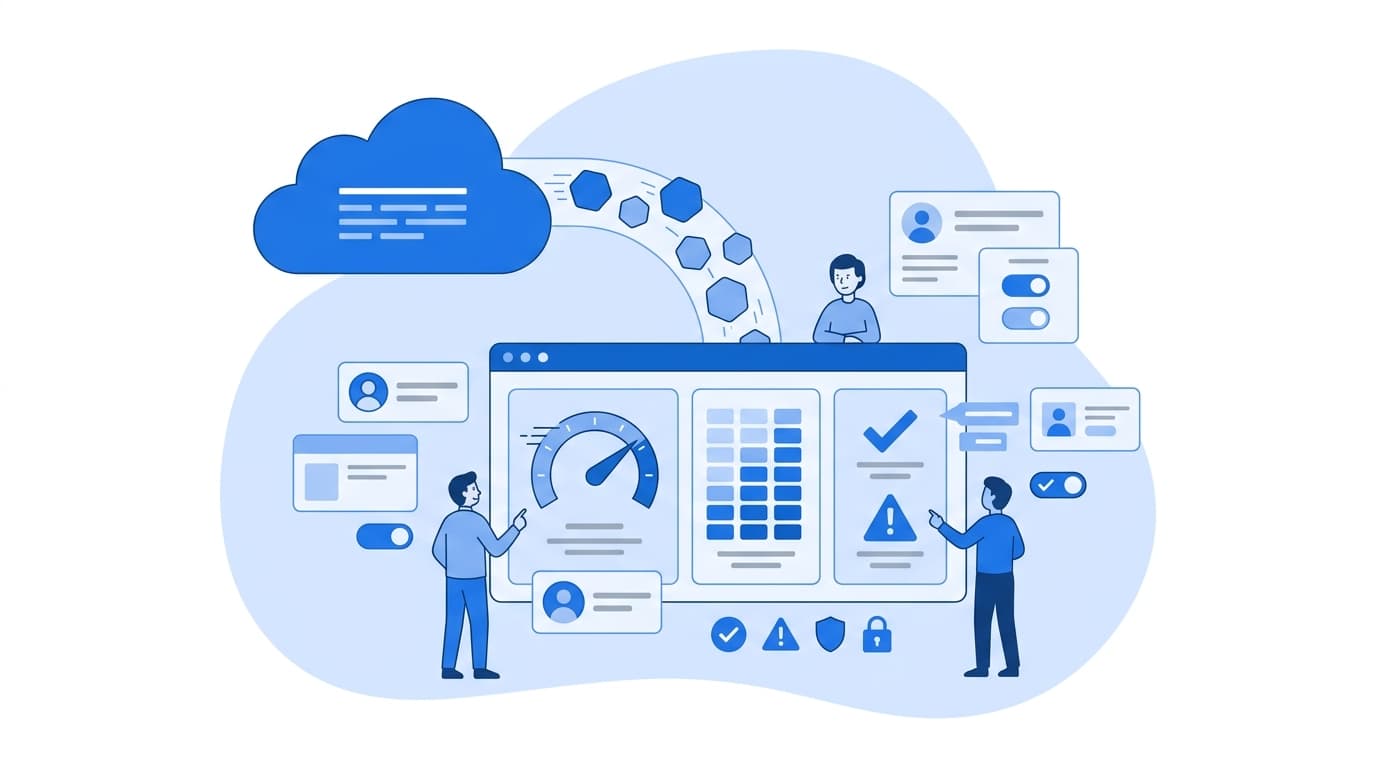
Tracking LLM telemetry comes down to instrumenting every model call as a traced span and recording three families of signals. Latency covers time to first token, time per output token, and end-to-end duration at p50, p95, and p99. Cost means input, output, and cached tokens multiplied by a versioned price table and attributed to a feature and tenant. Quality combines deterministic checks, user feedback, and sampled evaluations tied to a specific prompt and model version. Use the OpenTelemetry generative AI semantic conventions as your schema, keep prompt content capture opt-in, and alert on percentiles and budgets rather than averages.
The rest of this post walks through how we approach each of those pieces in practice, with code you can adapt.
Why LLM Telemetry Is Different From Standard APM
If you already run a mature APM stack, it is tempting to treat an LLM call like any other HTTP dependency. That gets you request counts and durations, but it misses the things that actually hurt in production:
- Duration depends on output length. A slow request might be a slow provider, or it might be a model that generated 2,000 tokens when you expected 200. Without token counts on the same span, you cannot tell the difference.
- Cost is per token, not per request. Two requests with identical latency can differ in cost by an order of magnitude depending on context size.
- A 200 OK can still be a failure. The model can return well-formed JSON with the wrong answer, a refusal, or a truncated response (
finish_reason: length). Your error rate dashboard will show green. - Behavior changes without a deploy. Provider-side model updates, prompt edits, and retrieval index changes all shift outputs. You need version metadata on every call to correlate regressions with causes.
So LLM telemetry needs a richer data model than generic HTTP tracing.
The LLM Telemetry Data Model: One Span Per Model Call
We recommend starting from the OpenTelemetry Semantic Conventions for Generative AI rather than inventing attribute names. The conventions are still marked as in development, so pin the version you adopt, but they give you a shared vocabulary that vendors and open-source backends increasingly understand.
At minimum, each model call span should carry:
gen_ai.operation.name(for examplechatorembeddings)gen_ai.request.modelandgen_ai.response.model(these can differ when a provider resolves an alias)gen_ai.usage.input_tokensandgen_ai.usage.output_tokensgen_ai.response.finish_reasons- Request parameters that affect output:
gen_ai.request.temperature,gen_ai.request.max_tokens
Then add your own application attributes. These are what make the data actionable:
app.feature(which product surface triggered the call)app.tenant_idor cost centerapp.prompt.template_idandapp.prompt.versionapp.retrieval.doc_countfor RAG pipelines
Model the call as a child span of the user request, with sibling spans for retrieval, reranking, tool calls, and post-processing. That trace shape is what lets you answer "where did the time go?" in one view.
LLM Latency Metrics That Matter
End-to-end duration alone is not enough, especially for streaming interfaces. Track these separately:
- Time to first token (TTFT). This drives perceived responsiveness in chat UIs. It is dominated by queueing, prompt processing (prefill), and network.
- Time per output token (TPOT). Also called inter-token latency. It determines how fast text appears once streaming begins and reflects decode throughput.
- End-to-end duration. Roughly TTFT plus TPOT times output tokens, plus overhead. This is the number that matters for batch jobs and agent steps.
- Pipeline stage latency. Retrieval, reranking, guardrail checks, and tool execution often account for more wall-clock time than the model itself.
Report percentiles, not means. Latency distributions are long-tailed, and as the Google SRE book's chapter on service level objectives explains, averages hide the tail that users actually feel.
Here is a minimal Python pattern for capturing TTFT and token usage on a streaming call. The client.stream call is a stand-in for whatever SDK you use.
import time
from opentelemetry import trace, metrics

tracer = trace.get_tracer("app.llm")
meter = metrics.get_meter("app.llm")

duration_hist = meter.create_histogram(
    "gen_ai.client.operation.duration", unit="s"
)
token_hist = meter.create_histogram(
    "gen_ai.client.token.usage", unit="{token}"
)
ttft_hist = meter.create_histogram(
    "app.llm.time_to_first_token", unit="s"
)

def stream_completion(client, model, messages, feature, prompt_version):
    attrs = {
        "gen_ai.operation.name": "chat",
        "gen_ai.request.model": model,
        "app.feature": feature,
        "app.prompt.version": prompt_version,
    }
    with tracer.start_as_current_span(f"chat {model}", attributes=attrs) as span:
        start = time.monotonic()
        first_token_at = None
        chunks = []

        stream = client.stream(model=model, messages=messages)
        for chunk in stream:
            if first_token_at is None and chunk.text:
                first_token_at = time.monotonic()
                ttft_hist.record(first_token_at - start, attrs)
            chunks.append(chunk.text or "")

        elapsed = time.monotonic() - start
        usage = stream.final_usage()  # provider-specific

        span.set_attribute("gen_ai.usage.input_tokens", usage.input_tokens)
        span.set_attribute("gen_ai.usage.output_tokens", usage.output_tokens)
        span.set_attribute("gen_ai.response.finish_reasons", [usage.finish_reason])

        duration_hist.record(elapsed, attrs)
        token_hist.record(usage.input_tokens, {**attrs, "gen_ai.token.type": "input"})
        token_hist.record(usage.output_tokens, {**attrs, "gen_ai.token.type": "output"})

        if first_token_at and usage.output_tokens > 1:
            tpot = (elapsed - (first_token_at - start)) / (usage.output_tokens - 1)
            span.set_attribute("app.llm.time_per_output_token", tpot)

        return "".join(chunks)
Note that we use a custom name for client-side TTFT. The semantic conventions define TTFT and TPOT as server-side metrics for model hosts, so we avoid reusing those names for a client measurement that includes network time.
LLM Cost Tracking You Can Actually Reconcile
Cost tracking fails in two common ways: hardcoded prices that drift from reality, and totals with no attribution. Both are fixable.
Keep prices in a versioned config, not in code. Providers change pricing, and many charge differently for cached input tokens or batch requests. Store an effective date so historical cost stays correct after a price change.
# pricing.yaml: fill values from each provider's current published price sheet
- model: provider-a/model-large
  effective_from: 2025-01-01
  usd_per_1m_input_tokens: 0.00
  usd_per_1m_cached_input_tokens: 0.00
  usd_per_1m_output_tokens: 0.00
Compute cost at query time, not at emit time. Emit raw token counts on spans, then join against the price table in your warehouse. This lets you correct pricing errors retroactively.
SELECT
  s.feature,
  s.tenant_id,
  DATE_TRUNC('day', s.start_time) AS day,
  SUM(s.input_tokens  * p.usd_per_1m_input_tokens  / 1e6
    + s.output_tokens * p.usd_per_1m_output_tokens / 1e6) AS cost_usd,
  COUNT(*) AS calls
FROM llm_spans s
JOIN pricing p
  ON s.response_model = p.model
 AND s.start_time >= p.effective_from
 AND (p.effective_to IS NULL OR s.start_time < p.effective_to)
GROUP BY 1, 2, 3;
A few practices that consistently pay off:
- Count retries and failed calls. You pay for tokens on requests that later time out or fail validation. Tag spans with
app.retry_attempt. - Track cost per successful outcome, not just per call. An agent that takes eight model calls to finish a task costs more than one that takes three, even if per-call cost is lower.
- Reconcile monthly against provider invoices. A gap usually means uninstrumented call paths.
- Set budget alerts per feature and tenant, so a runaway loop in one workflow pages someone before the invoice arrives.
LLM Quality Metrics: Layered, Versioned, and Sampled
Quality is the hardest of the three because there is rarely a single ground truth. We use layers, cheapest first:
Deterministic checks (every request)
- Schema validation pass rate for structured output
finish_reasondistribution (spikes inlengthsignal truncation)- Refusal or empty-response rate
- Guardrail trigger rate (PII, policy filters)
User signals (every request where available)
- Explicit feedback (thumbs up/down)
- Implicit signals: regenerate clicks, edits to generated text, abandonment, escalation to a human
Sampled evaluations (a fraction of traffic)
- LLM-as-judge scoring against a rubric for relevance, groundedness, or faithfulness to retrieved context. Treat these scores as noisy and validate the judge against human labels before trusting trends. The OpenAI Evals repository and similar open-source frameworks are useful references for structuring this.
- Periodic human review of a stratified sample
Offline regression (every prompt or model change)
- Run a fixed golden dataset before deploying any prompt, model, or retrieval change, and compare scores to the previous version.
The critical step is joining quality signals back to the trace using the span or trace ID, so every score is attributable to a prompt version, model, and feature. Without that join, you can see that quality dropped but not why.
Dashboards and Alerts for LLMOps Monitoring
Once the data flows, a practical LLMOps monitoring setup includes:
- Per-feature overview: call volume, p95 TTFT, p95 end-to-end latency, cost per day, schema pass rate
- Model comparison: latency and cost by
gen_ai.response.model, useful during migrations - Prompt version panel: quality and cost before and after each prompt change
Alert on:
- p95 or p99 latency breaching an SLO for a sustained window
- Daily cost exceeding a per-feature budget
- Schema failure or
lengthfinish rate above a baseline threshold you set from your own historical data - A drop in sampled quality score after a version change
Privacy, Content Capture, and Retention
Prompts and completions often contain personal or confidential data. The OpenTelemetry GenAI conventions treat message content capture as opt-in for this reason. Our default approach:
- Record metadata (tokens, timings, versions) on all spans
- Capture full content only in sampled, access-controlled storage with a short retention window
- Redact or hash identifiers before export
- Document what is captured so your security and compliance teams can review it
Regulated environments have stricter requirements here. If that applies to you, see how these patterns map to your sector on our industries page.
A Practical Rollout Plan
- Wrap every model call in a single client library that emits spans and metrics. No direct SDK calls from feature code.
- Adopt the GenAI semantic conventions plus your
app.*attributes. - Ship token counts and latency first, since they are cheap and immediately useful.
- Add the pricing table and cost queries.
- Add deterministic quality checks, then user feedback, then sampled evaluations.
- Build the golden dataset and gate prompt changes on it.
If you want support designing or hardening this kind of pipeline, our data, AI, and MLOps capabilities cover observability architecture alongside the platforms it runs on.
FAQ
What is LLM telemetry?
LLM telemetry is the structured collection of traces, metrics, and evaluation signals from large language model calls in production. It covers latency (including time to first token), token usage and cost, and output quality, with enough metadata to attribute each signal to a model, prompt version, and feature.
Which LLM latency metrics should I track first?
Start with time to first token and end-to-end duration at p50, p95, and p99, broken down by model and feature. Add time per output token if you stream responses, and instrument retrieval and tool steps as separate spans so you can see non-model latency.
How do I calculate LLM cost accurately?
Record input, cached input, and output token counts on every span. Then join them at query time against a versioned price table with effective dates. Include retries and failed calls, and reconcile totals against provider invoices regularly.
Is LLM-as-judge reliable enough for quality monitoring?
It is useful for spotting trends on sampled traffic, but treat it as a noisy signal. Validate the judge against human-labeled examples, keep the rubric and judge model versioned, and combine it with deterministic checks and user feedback rather than relying on it alone.
Should I log full prompts and responses?
Not by default. Log metadata on every call, and capture full content only for a sample, with redaction, access controls, and short retention. This follows the opt-in approach in the OpenTelemetry GenAI conventions and reduces privacy and compliance risk.