What are Best Practices for Building a 24/7 SRE Pipeline in Google Kubernetes Engine (GKE)?
A reliable SRE pipeline GKE teams can trust at 3 a.m. comes down to four things: codified service level objectives, automated deployments with safe rollback, layered observability wired to actionable alerts, and an on-call rotation backed by runbooks and blameless post-incident review. If you get those four right, 24/7 reliability stops being heroics and becomes a repeatable system. This post walks through each layer with concrete configuration you can adapt to your own Google Kubernetes Engine clusters.
Most reliability problems I see are not caused by a lack of tooling. They are caused by tooling that nobody wired together into a coherent loop. Let's fix that.
Start With SLOs, Not Dashboards
Before you build any automation, decide what "healthy" means in numbers. A 24/7 pipeline that alerts on everything alerts on nothing, because responders learn to ignore it.
Define Service Level Objectives (SLOs) per user-facing service, and derive an error budget from each. The error budget is what tells you whether to ship features or freeze and fix.
- SLI (indicator): the measured signal, e.g. proportion of HTTP requests under 300 ms.
- SLO (objective): the target, e.g. 99.9% of requests succeed over a rolling 28 days.
- Error budget: 100% minus the SLO. At 99.9%, you get roughly 43 minutes of unavailability per month.
Google's SRE workbook is the canonical reference here, and its guidance on error budgets is worth reading before you write a single alert rule (source: Google SRE Workbook).
A practical SLO defined as a Prometheus recording rule looks like this:
groups:
- name: slo-checkout
  rules:
  - record: checkout:availability:ratio_rate5m
    expr: |
      sum(rate(http_requests_total{job="checkout",code!~"5.."}[5m]))
      /
      sum(rate(http_requests_total{job="checkout"}[5m]))
You then alert on burn rate, not raw error counts. A fast burn (consuming the monthly budget in hours) pages someone. A slow burn opens a ticket. This distinction is the single biggest lever for reducing alert fatigue in a 24/7 rotation.
Building the SRE Pipeline in GKE: Deployment and Rollback
The deployment layer is where most outages are actually caused, so this is where your SRE pipeline GKE design earns its keep. The goal is simple: no change reaches production without an automated way to detect regression and revert it.
Use progressive delivery
Do not ship to 100% of traffic at once. Roll out incrementally and let metrics gate each step. On GKE, you can implement this with a service mesh plus a progressive delivery controller such as Argo Rollouts or Flagger.
A canary strategy with automated analysis looks like this:
apiVersion: argoproj.io/v1alpha1
kind: Rollout
metadata:
  name: checkout
spec:
  strategy:
    canary:
      steps:
      - setWeight: 10
      - pause: {duration: 5m}
      - analysis:
          templates:
          - templateName: error-rate
      - setWeight: 50
      - pause: {duration: 10m}
      - setWeight: 100
  selector:
    matchLabels:
      app: checkout
The analysis step queries your SLI. If the canary's error rate exceeds threshold, the rollout aborts and traffic stays on the stable version. Nobody gets paged, because the pipeline caught it.
Make rollback boring
Rollback should be a single, well-rehearsed action, not an investigation. Keep deployment manifests in Git and treat the repository as the source of truth using a GitOps controller like Argo CD or Flux. Reverting a bad deploy becomes a git revert, and the controller reconciles the cluster back to the known-good state.
Key practices for the deployment layer:
- Immutable images tagged by commit SHA, never
latest. - Health checks that mean something. Configure
readinessProbeandlivenessProbeso Kubernetes never routes traffic to a pod that cannot serve. - PodDisruptionBudgets so node upgrades and autoscaling do not take down more replicas than your SLO can tolerate.
apiVersion: policy/v1
kind: PodDisruptionBudget
metadata:
  name: checkout-pdb
spec:
  minAvailable: 2
  selector:
    matchLabels:
      app: checkout
If your team wants help designing this end to end, our cloud and infrastructure capabilities cover GKE pipeline architecture and progressive delivery.
Observability That Feeds Automation
You cannot operate what you cannot see, and you cannot automate what you cannot measure. A mature GKE reliability posture rests on the three pillars of observability, all correlated by consistent labels.
- Metrics: Prometheus (or Google Cloud Managed Service for Prometheus) for SLIs, saturation, and resource pressure.
- Logs: structured JSON logs shipped to Cloud Logging, queryable by trace ID.
- Traces: OpenTelemetry instrumentation exported to Cloud Trace so you can follow a slow request across services.
The critical detail is correlation. Emit a trace_id in every log line and metric exemplar so an on-call engineer can pivot from a burning SLO to the exact traces and logs behind it without guessing.
Golden signals first
Instrument the four golden signals for every service before you add anything else:
- Latency (distinguish successful from failed request latency).
- Traffic (requests per second).
- Errors (rate of failed requests).
- Saturation (how full your most constrained resource is).
These four cover the majority of incident scenarios and keep dashboards focused. Resist the urge to graph everything.
The 24/7 On-Call System
Automation reduces toil, but people still own reliability. A functioning 24/7 SRE rotation needs three things wired together: escalation, runbooks, and review.
Escalation policy
Route alerts through a paging tool with tiered escalation. A page unacknowledged in a few minutes escalates to a secondary responder, then to an engineering lead. Follow the sun where team geography allows, so nobody carries a pager overnight indefinitely. Sustainable on-call is a reliability control, not a nicety: exhausted engineers cause outages.
Runbooks attached to alerts
Every page should link to a runbook. A good runbook answers: what does this alert mean, what is the likely blast radius, what are the first three diagnostic commands, and what is the safe mitigation.
# Runbook: checkout high error rate
kubectl -n prod get rollout checkout
kubectl -n prod logs -l app=checkout --tail=100 | grep -i error
# Mitigate: abort in-flight rollout
kubectl argo rollouts abort checkout -n prod
Blameless post-incident review
After any incident that burns significant error budget, run a blameless postmortem. Focus on the system and the missing safeguards, not the individual. Track action items to closure. This feedback loop is what turns Kubernetes SRE best practices from a checklist into an improving system.
Automating the Toil Away
SRE automation is about eliminating repetitive manual work so responders spend time on judgment, not keystrokes.
- Autoscaling: Use the Horizontal Pod Autoscaler for pods and Cluster Autoscaler or node auto-provisioning for nodes so capacity tracks demand automatically.
- Self-healing: Rely on Kubernetes controllers and PodDisruptionBudgets rather than manual pod restarts.
- Policy as code: Enforce guardrails with a policy engine such as Open Policy Agent Gatekeeper so misconfigured workloads never reach production.
- Chaos testing: Periodically inject controlled failures in a staging cluster to verify your alerts fire and your rollbacks work. An untested runbook is a hypothesis.
A minimal HPA that scales on both CPU and a custom SLI-adjacent metric:
apiVersion: autoscaling/v2
kind: HorizontalPodAutoscaler
metadata:
  name: checkout
spec:
  scaleTargetRef:
    apiVersion: apps/v1
    kind: Deployment
    name: checkout
  minReplicas: 3
  maxReplicas: 20
  metrics:
  - type: Resource
    resource:
      name: cpu
      target:
        type: Utilization
        averageUtilization: 65
Regulated and high-availability sectors have particular requirements here around change control and audit trails. We describe how these patterns adapt across sectors in our industries overview.
Putting It Together
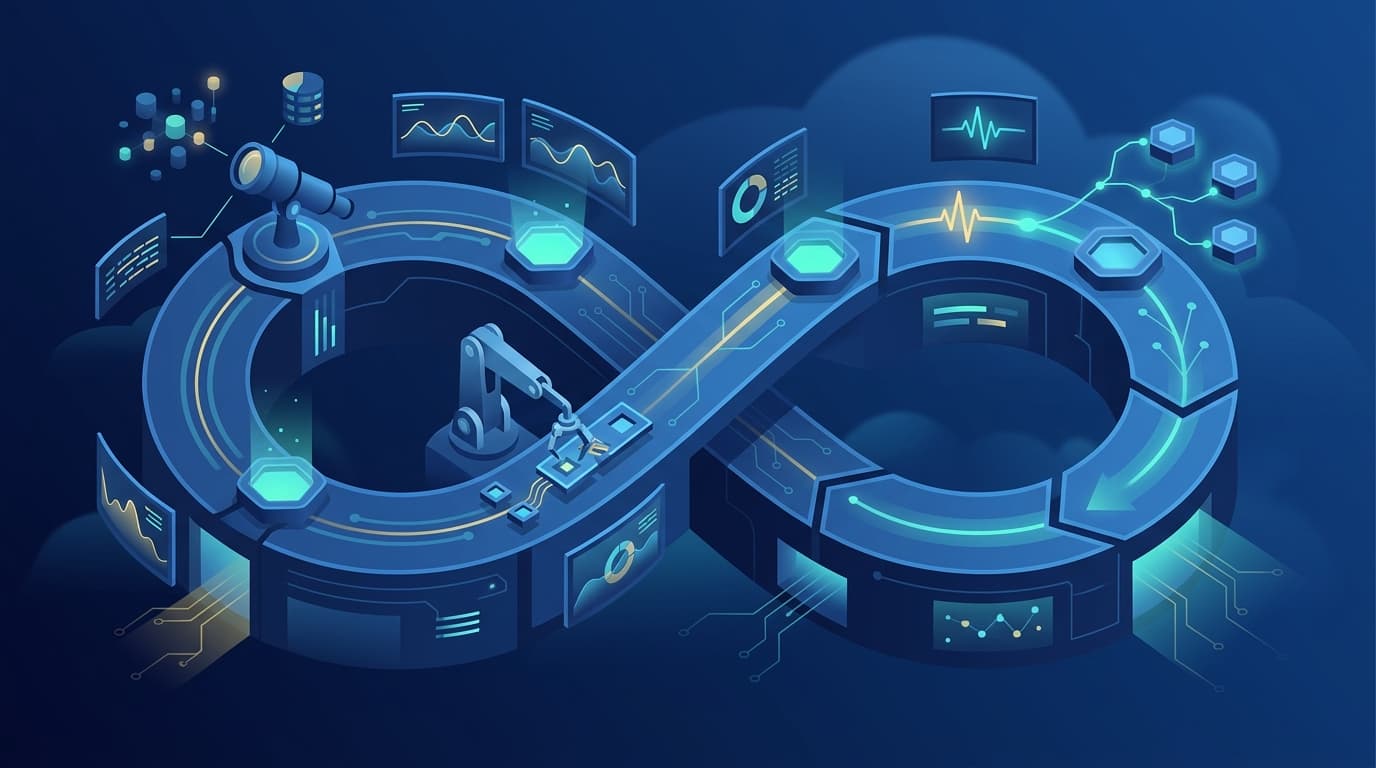
A production-grade pipeline is a loop, not a list. SLOs define acceptable risk. Progressive delivery and GitOps enforce safe change. Observability detects deviation and feeds it back to burn-rate alerts. On-call responders act on runbooks, and postmortems close the gaps that let the incident happen. Automation shrinks the manual surface at every step.
Build it in that order. Teams that start with dashboards and paging before defining SLOs tend to drown in noise. Teams that start with objectives and work outward end up with a calmer, more reliable system, and an on-call rotation people can actually sustain.
FAQ
What is the difference between an SLO and an error budget in a GKE SRE pipeline?
An SLO is the reliability target you commit to, such as 99.9% availability over 28 days. The error budget is the inverse, the amount of unreliability you can spend before you must stop shipping features and focus on stability. In a GKE pipeline, the error budget drives decisions: burn it too fast and your progressive delivery gates and release policy tighten automatically.
How do I prevent alert fatigue in a 24/7 SRE rotation?
Alert on symptoms users feel, not on every internal fluctuation. Use SLO burn-rate alerts so fast burns page a human while slow burns create tickets. Attach a runbook to every page, and review alert quality in postmortems. Any alert that never leads to action should be deleted or downgraded.
Do I need a service mesh for progressive delivery on GKE?
Not strictly, but a mesh makes traffic-weighted canaries much cleaner. Controllers like Argo Rollouts and Flagger integrate with meshes to shift traffic percentages and run automated analysis. Without a mesh, you can still do replica-based canaries, though traffic splitting is coarser.
How much of GKE reliability can realistically be automated?
Detection, scaling, self-healing, rollback, and policy enforcement can be automated to a high degree. Human judgment remains essential for novel incidents, ambiguous tradeoffs, and postmortem analysis. The goal of SRE automation is to remove repetitive toil so responders focus on the problems only people can solve.
What should a GKE runbook contain?
A concise description of what the alert means, the likely blast radius, the first diagnostic commands, and the safest mitigation, including how to abort or roll back a deployment. Keep it short enough to follow under pressure and test it regularly with chaos exercises.