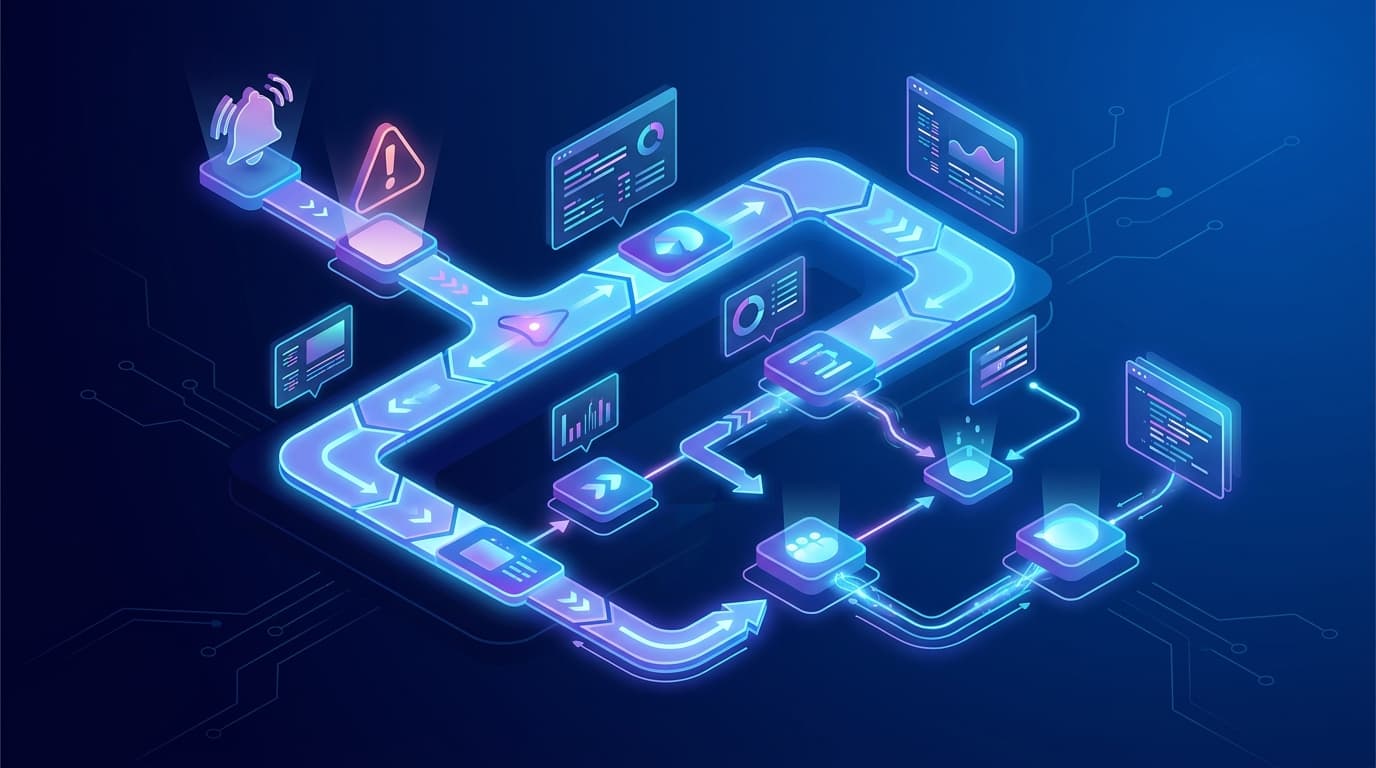
A Step-by-Step Guide to Building a 24/7 SRE Pipeline with Kubernetes and AWS
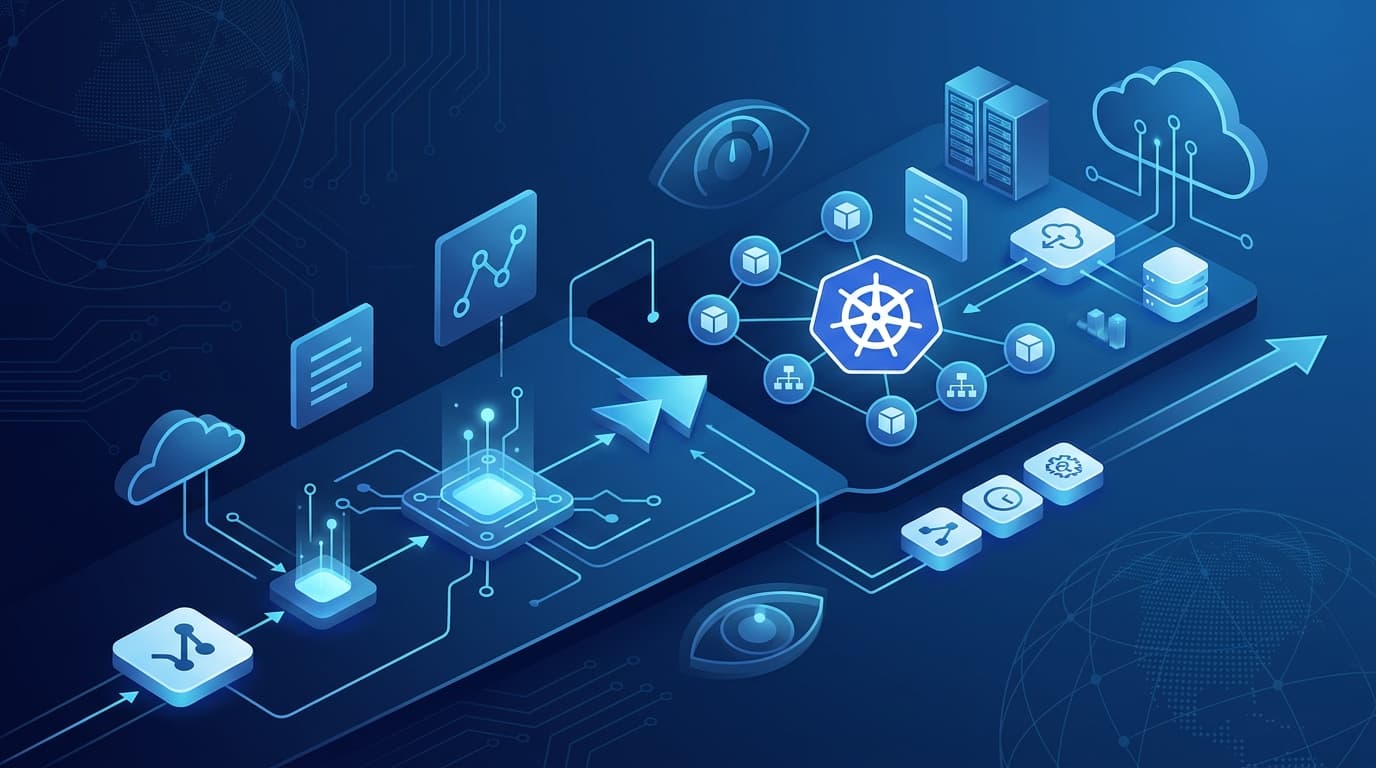
If you want a 24/7 SRE pipeline on Kubernetes and AWS, the shortest path is to wire together five things: declarative infrastructure, a GitOps deployment flow, service-level objectives with error budgets, an observability stack that feeds automated alerting, and an on-call rotation with runbooks that anyone on the team can execute at 3 a.m. This guide walks through each layer in order, with concrete configuration you can adapt. The goal of an SRE pipeline is not heroics. It is a system that catches regressions before users do, and that lets a small team sleep while the platform defends itself.
I have built variations of this on production clusters, and the sequence below reflects what tends to fail first when you skip a step. Do them in order.
What a 24/7 SRE Pipeline Actually Needs
Before touching YAML, be clear about the components. A reliable pipeline is a loop, not a line:
- Codified infrastructure so environments are reproducible.
- Continuous delivery with automated rollback.
- SLOs and error budgets that define "healthy" in numbers, not opinions.
- Observability: metrics, logs, and traces that answer "what changed."
- Alerting and on-call that route the right signal to the right human.
- Incident response with runbooks and blameless review.
Each layer depends on the one before it. You cannot enforce an error budget without observability. You cannot roll back safely without declarative deploys. Build from the bottom.
Step 1: Codify the AWS Foundation
Start with infrastructure as code. For AWS site reliability engineering, I use Terraform to provision the VPC, subnets, and an EKS cluster. This makes the environment auditable and repeatable across regions, which matters when you are chasing true 24/7 coverage across availability zones.
module "eks" {
  source          = "terraform-aws-modules/eks/aws"
  cluster_name    = "prod-sre"
  cluster_version = "1.29"

  vpc_id     = module.vpc.vpc_id
  subnet_ids = module.vpc.private_subnets

  eks_managed_node_groups = {
    default = {
      min_size     = 3
      max_size     = 9
      desired_size = 3
      instance_types = ["m6i.large"]
    }
  }
}
Spread node groups across at least three AZs. Single-AZ clusters are a common cause of avoidable outages. Store Terraform state in an S3 backend with DynamoDB locking so concurrent applies do not corrupt state.
Step 2: Build the GitOps Deployment Flow
Manual kubectl apply does not scale and leaves no audit trail. For Kubernetes SRE, adopt a GitOps controller such as Argo CD or Flux. The desired state lives in Git; the controller reconciles the cluster to match. Rollback becomes a git revert.
apiVersion: argoproj.io/v1alpha1
kind: Application
metadata:
  name: payments-api
  namespace: argocd
spec:
  project: default
  source:
    repoURL: https://github.com/acme/deploy.git
    targetRevision: main
    path: apps/payments
  destination:
    server: https://kubernetes.default.svc
    namespace: payments
  syncPolicy:
    automated:
      prune: true
      selfHeal: true
selfHeal: true matters for reliability: if someone hotfixes a deployment by hand, the controller reverts it to the committed state. That prevents configuration drift, one of the quietest sources of 2 a.m. surprises.
Progressive Delivery
Do not ship straight to 100% of traffic. Use a canary strategy with Argo Rollouts or a service mesh so a bad release affects a fraction of users. Tie the canary analysis to your SLO metrics from Step 4, and the rollout will abort automatically when latency or error rate degrades.
strategy:
  canary:
    steps:
      - setWeight: 10
      - pause: { duration: 5m }
      - analysis:
          templates:
            - templateName: error-rate-check
      - setWeight: 50
      - pause: { duration: 10m }
Step 3: Define SLOs and Error Budgets
This is the step most teams skip, and it is the one that makes the difference between an ops team and an SRE practice. An SLO turns reliability into a measurable target. An error budget is the allowed unreliability: if your availability SLO is 99.9% over 30 days, you have roughly 43 minutes of budget to spend.
Pick a handful of user-facing indicators. For an API, that usually means:
- Availability: successful requests / total requests.
- Latency: proportion of requests under a threshold, for example 95% under 300 ms.
Write these down and agree on them with product stakeholders. The error budget becomes a decision tool: when the budget is healthy, ship features fast; when it is spent, freeze feature work and invest in reliability. That policy is what keeps a 24/7 SRE effort sustainable instead of burning out the team.
Step 4: Stand Up Observability
You cannot defend what you cannot see. On EKS, a common baseline is Prometheus for metrics, Loki or CloudWatch for logs, and OpenTelemetry with a backend like Tempo or Jaeger for traces. Deploy Prometheus and Grafana via the kube-prometheus-stack Helm chart.
helm repo add prometheus-community \
  https://prometheus-community.github.io/helm-charts
helm install monitoring prometheus-community/kube-prometheus-stack \
  -n monitoring --create-namespace
Instrument services to expose the metrics your SLOs depend on. Record a burn rate: how fast you are consuming the error budget. Multi-window, multi-burn-rate alerting, described in the Google SRE Workbook, reduces false pages by requiring both a fast and a slow window to fire.
- alert: HighErrorBudgetBurn
  expr: |
    (
      sum(rate(http_requests_total{code=~"5.."}[5m]))
      / sum(rate(http_requests_total[5m]))
    ) > (14.4 * 0.001)
  for: 2m
  labels:
    severity: page
The 14.4 multiplier corresponds to burning through a 30-day budget quickly enough to warrant an immediate page. Slower burns can route to a ticket instead of a phone call. This distinction is what stops alert fatigue.
Step 5: Wire Alerting and On-Call
Route Prometheus Alertmanager to a paging tool such as PagerDuty or Opsgenie. The routing rule is simple: severity: page interrupts a human, everything else creates a ticket. Define escalation policies so an unacknowledged page reaches a secondary responder within minutes.
For genuine 24/7 coverage with a small team, a follow-the-sun rotation across time zones beats forcing one region to cover nights. If that is not possible, keep rotations short, one week maximum, and compensate on-call time explicitly.
Step 6: Runbooks and Blameless Incident Review
Every alert should link to a runbook. A good runbook states the symptom, the likely cause, the diagnostic commands, and the remediation. Store them in the same repo as your manifests so they are version-controlled.
## Runbook: HighErrorBudgetBurn on payments-api

Symptom: 5xx rate above SLO threshold.
Check: kubectl logs -n payments deploy/payments-api --tail=100
Check: recent deploy? argocd app history payments-api
Mitigate: argocd app rollback payments-api <prev-revision>
Escalate: #payments-oncall if not resolved in 15 min
After every incident, run a blameless postmortem. Focus on the system and the missing safeguards, not the individual. The output is action items: a new alert, a missing test, a runbook gap. This feedback loop is what turns a pipeline into a practice.
If you are formalizing this across a growing platform, our cloud and infrastructure capabilities cover how these layers fit into a broader reliability program. Reliability requirements also vary sharply by sector, and the constraints we see across regulated and high-availability industries shape how aggressive your SLOs and coverage need to be.
Putting the Loop Together
Read the six steps as a cycle. Infrastructure is codified, deploys are automated and reversible, SLOs define health, observability measures it, alerts fire on burn rate, and postmortems feed improvements back into code and configuration. Each turn of the loop makes the next incident less likely and less painful.
A practical rollout order for a team new to this:
- Terraform the cluster and get GitOps reconciling one service.
- Add Prometheus and Grafana; visualize before you alert.
- Write two or three SLOs for your most critical user journeys.
- Add burn-rate alerts and connect on-call.
- Introduce canary deploys tied to those SLOs.
- Make postmortems a standing habit.
Resist the urge to instrument everything at once. Reliability compounds when you focus on the few signals that map to user pain, and let the pipeline enforce them automatically.
FAQ
How long does it take to build a production SRE pipeline?
A minimal but real pipeline, meaning IaC, GitOps, one SLO, and burn-rate alerting, is achievable in a few weeks for a focused team. Maturing it with canary analysis, full trace coverage, and a tested on-call rotation is a quarter-long effort. Treat it as iterative rather than a single project.
Do I need Kubernetes for an SRE pipeline?
No. The principles, SLOs, error budgets, observability, and blameless review, apply to any platform. Kubernetes and AWS make progressive delivery and declarative rollback easier, which is why they pair well with SRE, but the practice matters more than the tooling.
What is the difference between monitoring and observability here?
Monitoring tells you a known condition occurred, for example error rate crossed a threshold. Observability lets you ask new questions about unexpected behavior using high-cardinality metrics, logs, and traces. An effective pipeline needs both: monitoring drives alerts, observability drives diagnosis during an incident.
How do error budgets change how we ship features?
The error budget is a shared agreement. When budget remains, teams ship at normal velocity. When it is exhausted, feature work pauses in favor of reliability fixes until the service recovers. This removes the recurring argument between shipping speed and stability by making the tradeoff explicit and data-driven.
What is the most common mistake teams make?
Alerting on causes instead of symptoms, which produces noisy pages that responders learn to ignore. Alert on user-facing SLO burn rate first, then add cause-based signals only where they speed up diagnosis. Fewer, higher-quality pages keep a 24/7 rotation sustainable.
Production-grade cloud, software, and engineering teams for scaling companies.